Weekly Market Commentary
April 27th, 2026
Week in Review
Economic data released during the week pointed to continued momentum in consumer spending alongside expansionary business activity, while select labor and inventory data suggested pockets of emerging pressure. Overall conditions reflected steady growth with mixed cross‑currents beneath the surface.
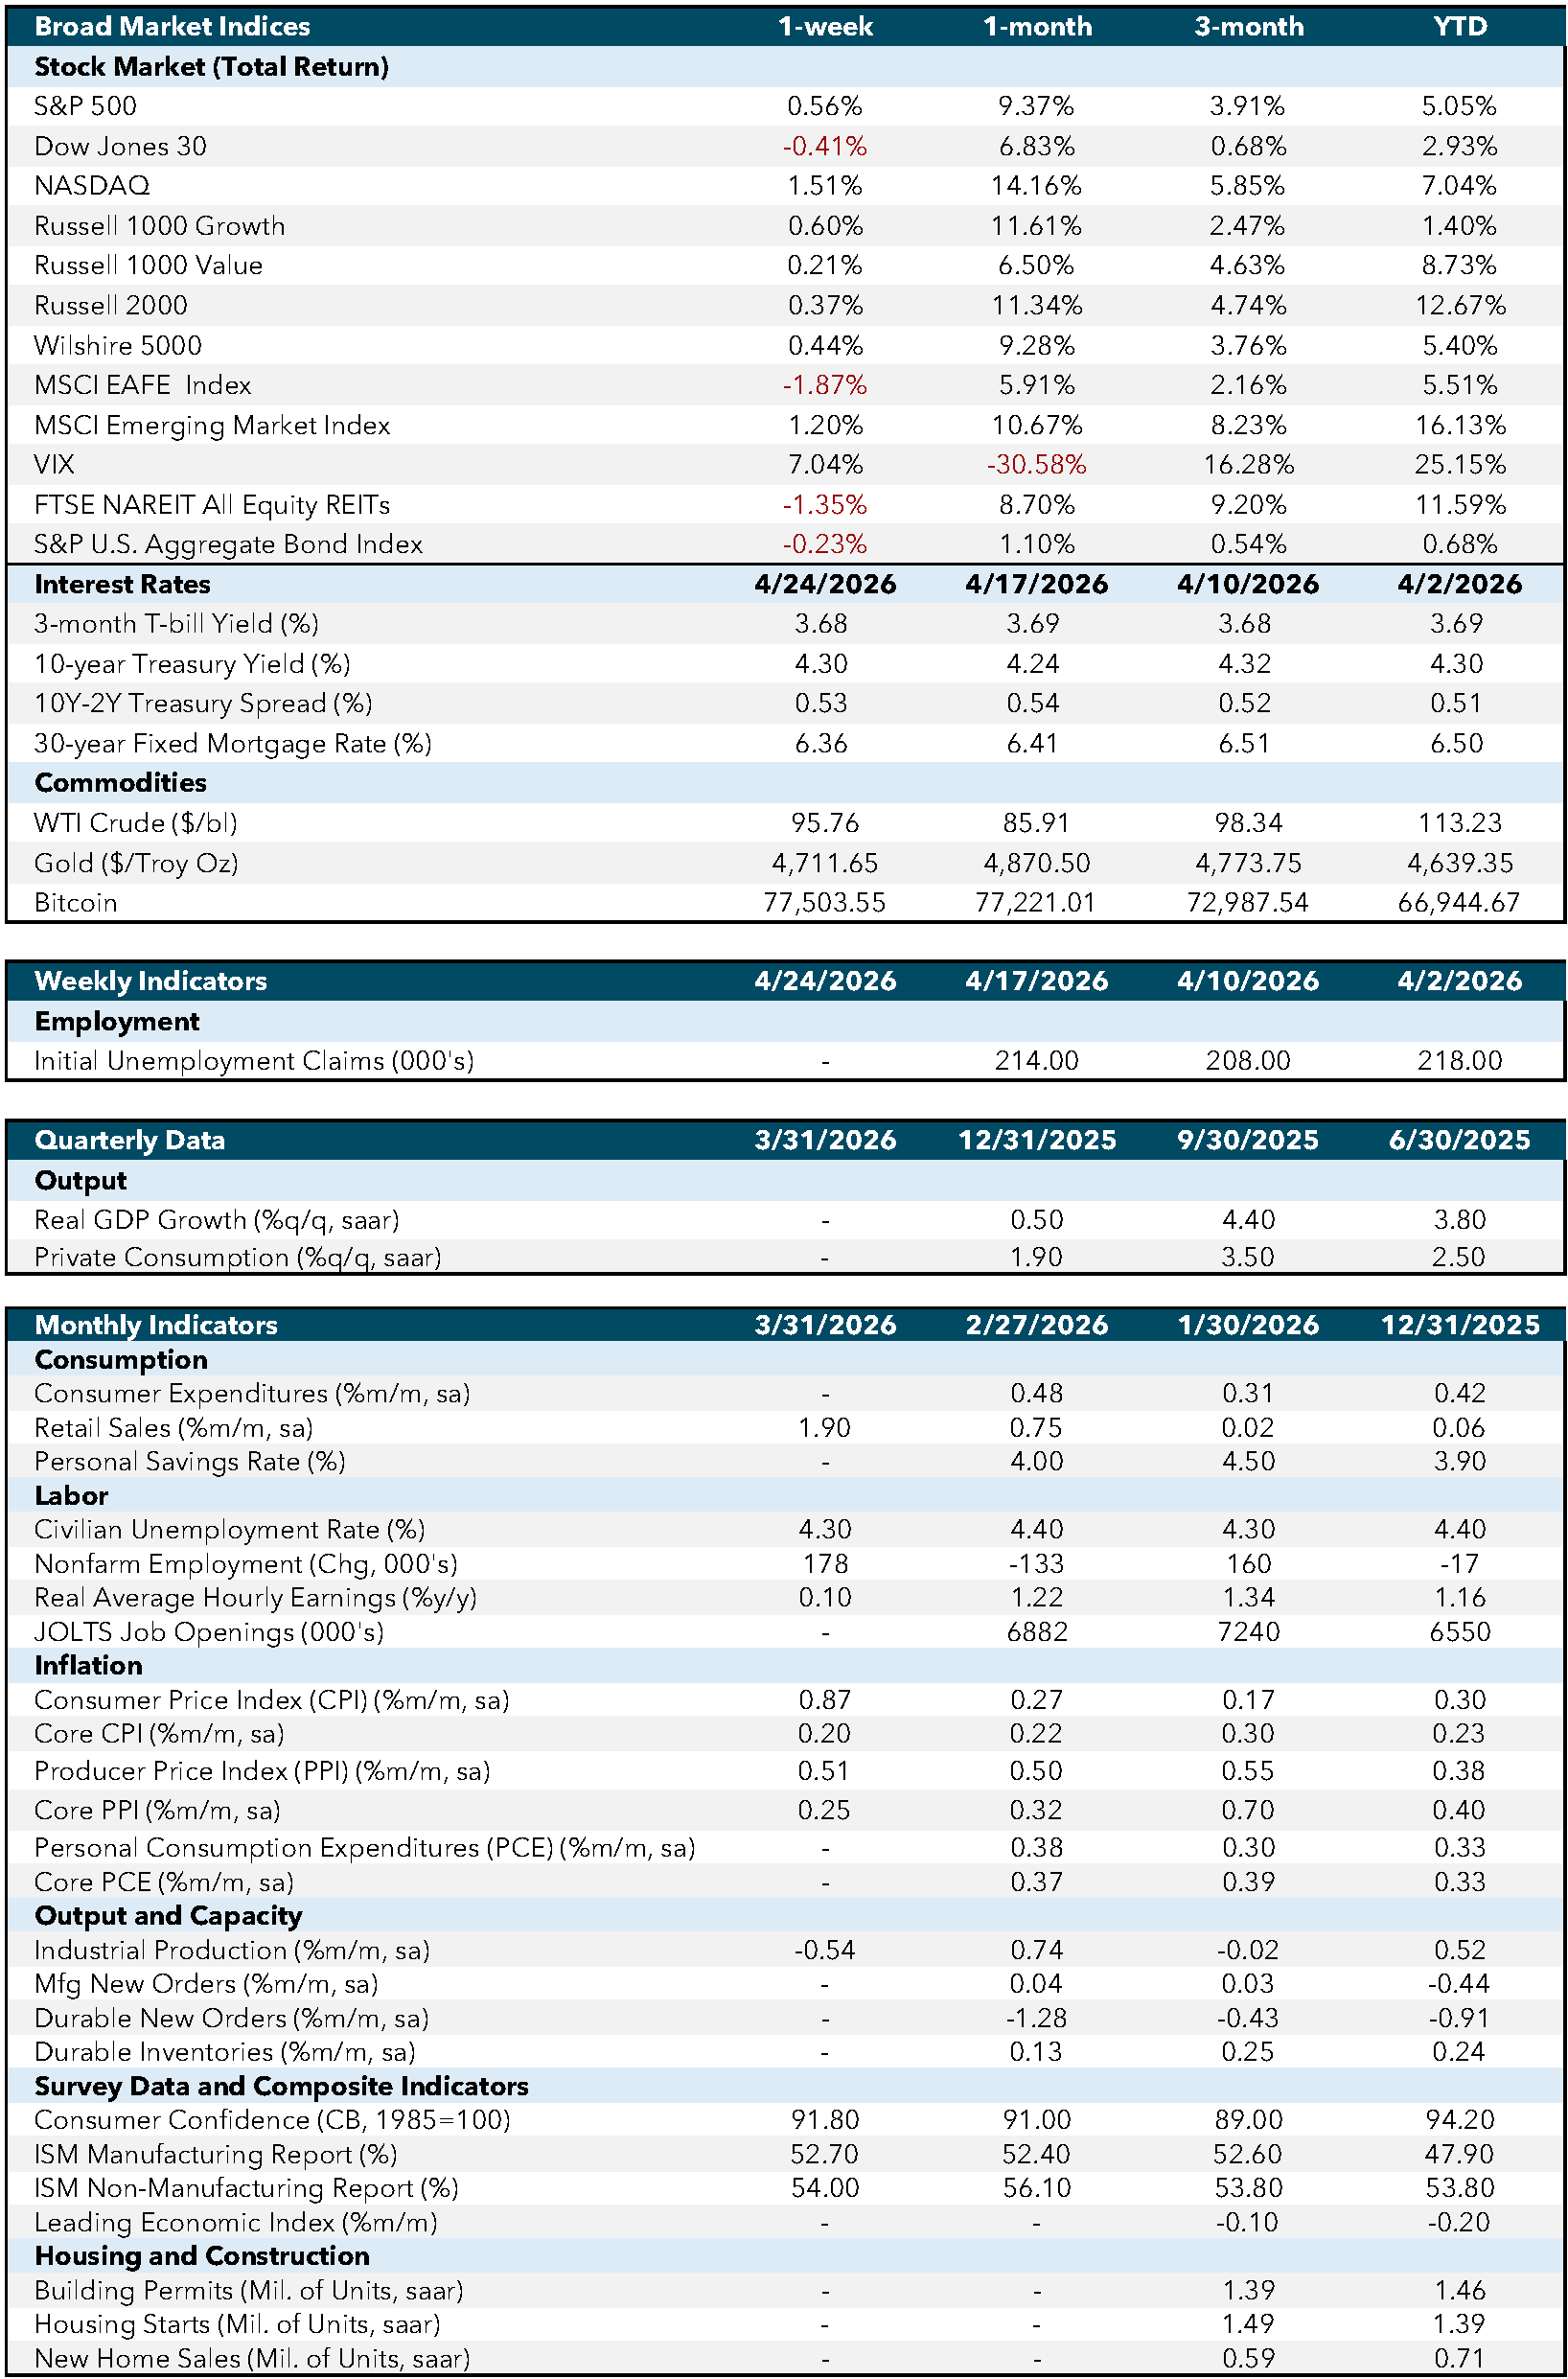
Consumer spending data surprised to the upside. March retail sales increased 1.7% month-over-month, significantly above expectations and accelerated from the prior reading. Core retail sales also rose 1.9%, indicating broad‑based strength beyond volatile categories. The data suggest that household demand remains resilient despite elevated prices and restrictive financial conditions.
Business activity indicators remained in expansion. The April Manufacturing Purchasing Managers’ Index (PMI) rose to 54.0, improving from March and exceeding expectations, signaling an acceleration in factory activity. Services activity also expanded, with the Services PMI increasing to 51.3 from contractionary territory previously, pointing to a modest rebound in service‑sector demand.
Labor market data showed early signs of softening at the margin. Initial jobless claims increased to 214,000, modestly above expectations and prior levels, though still low by historical standards. The data suggests gradual cooling rather than material deterioration in labor conditions.
Energy market data was mixed. Crude oil inventories recorded a larger‑than‑expected build, reversing prior drawdowns and potentially reflecting softer near‑term demand or supply normalization. While volatile week‑to‑week, inventory levels remain an area to monitor for inflation and growth implications.
Taken together, the week’s data reinforced a backdrop of resilient consumer demand and ongoing economic expansion, tempered by early indications of labor market normalization and uneven sector‑level dynamics.
Economic and Capital Markets Dashboard
Week Ahead…

The upcoming week will focus on inflation trends, growth momentum, and Federal Reserve policy signaling, with several high‑impact releases shaping views on economic resilience and disinflation progress.
Early‑week attention turns to the April Conference Board Consumer Confidence Index. After recent strength in retail sales, the data will be watched for confirmation that consumer optimism and spending capacity remain intact despite elevated prices and restrictive financial conditions.
Midweek focus shifts to monetary policy. Durable goods orders will provide insight into business investment and demand for longer‑cycle goods. The Federal Reserve’s policy decision, statement, and press conference are expected to reaffirm a pause in rate changes, with markets closely assessing language around inflation risks, growth conditions, and the potential timing of future adjustments. Crude oil inventories will also be monitored as energy prices remain a key near‑term driver of inflation expectations.
Late‑week releases include several critical macro indicators. Core Personal Consumption Expenditures (PCE) inflation, the Fed’s preferred measure, will be central to assessing whether underlying price pressures continue to cool at a pace consistent with eventual policy easing. The advanced estimate of first‑quarter GDP will provide a broader read on economic momentum, while initial jobless claims offer an updated view of labor market conditions. Regional and national PMI data, including Chicago PMI and ISM Manufacturing PMI, will further inform assessments of manufacturing‑sector expansion.
Overall, the week should clarify whether inflation moderation supports a potential policy shift later this year as growth and labor markets continue to normalize.
Economic Indicators:
- CPI: Consumer Price Index measures the average change in prices paid by consumers for goods and services over time. Source: Bureau of Labor Statistics.
- Core CPI: Core Consumer Price Index excludes food and energy prices to provide a clearer picture of long-term inflation trends. Source: Bureau of Labor Statistics.
- PPI: Producer Price Index measures the average change in selling prices received by domestic producers for their output. Source: Bureau of Labor Statistics.
- Core PPI: Core Producer Price Index excludes food and energy prices to provide a clearer picture of long-term inflation trends. Source: Bureau of Labor Statistics.
- PCE: Personal Consumption Expenditures measure the average change in prices paid by consumers for goods and services. Source: Bureau of Economic Analysis.
- Core PCE: Core Personal Consumption Expenditures exclude food and energy prices to provide a clearer picture of long-term inflation trends. Source: Bureau of Economic Analysis.
- Industrial Production: Measures the output of the industrial sector, including manufacturing, mining, and utilities. Source: Federal Reserve.
- Mfg New Orders: Measures the value of new orders placed with manufacturers for durable and non-durable goods. Source: Census Bureau.
- Durable New Orders: Measures the value of new orders placed with manufacturers of durable goods. Source: Census Bureau.
- Durable Inventories: Measures the value of inventories held by manufacturers for durable goods. Source: Census Bureau.
- Consumer Confidence (CB, 1985=100): Measures the degree of optimism that consumers feel about the overall state of the economy and their personal financial situation. Source: Conference Board.
- ISM Manufacturing Report: Measures the economic health of the manufacturing sector based on surveys of purchasing managers. Source: Institute for Supply Management.
- ISM Non-Manufacturing Report: Measures the economic health of the non-manufacturing sector based on surveys of purchasing managers. Source: Institute for Supply Management.
- Leading Economic Index: Measures overall economic activity and predicts future economic trends. Source: Conference Board.
- Building Permits (Mil. of Units, saar): Measures the number of new residential building permits issued. Source: Census Bureau.
- Housing Starts (Mil. of Units, saar): Measures the number of new residential construction projects that have begun. Source: Census Bureau.
- New Home Sales (Mil. of Units, saar): Measures the number of newly constructed homes sold. Source: Census Bureau.
- SA: Seasonally adjusted.
- SAAR: Seasonally adjusted annual rate.
Market Indices & Indicators:
- S&P 500: A market-capitalization-weighted index of 500 leading publicly traded companies in the U.S., widely regarded as one of the best gauges of large U.S. stocks and the stock market overall.
- Dow Jones 30: Also known as the Dow Jones Industrial Average, it tracks the share price performance of 30 large, publicly traded U.S. companies, serving as a barometer of the stock market and economy.
- NASDAQ: The world’s first electronic stock exchange, primarily listing technology giants and operating 29 markets globally.
- Russell 1000 Growth: Measures the performance of large-cap growth segment of the U.S. equity universe, including companies with higher price-to-book ratios and growth metrics.
- Russell 1000 Value: Measures the performance of large-cap value segment of the U.S. equity universe, including companies with lower price-to-book ratios and growth metrics.
- Russell 2000: A market index composed of 2,000 small-cap companies, widely used as a benchmark for small-cap mutual funds.
- Wilshire 5000: A market-capitalization-weighted index capturing the performance of all American stocks actively traded in the U.S., representing the broadest measure of the U.S. stock market.
- MSCI EAFE Index: An equity index capturing large and mid-cap representation across developed markets countries around the world, excluding the U.S. and Canada.
- MSCI Emerging Market Index: Captures large and mid-cap representation across emerging markets countries, covering approximately 85% of the free float-adjusted market capitalization in each country.
- VIX: The CBOE Volatility Index measures the market’s expectations for volatility over the coming 30 days, often referred to as the “fear gauge.”
- FTSE NAREIT All Equity REITs: Measures the performance of all publicly traded equity real estate investment trusts (REITs) listed in the U.S., excluding mortgage REITs.
- S&P U.S. Aggregate Bond Index: Represents the performance of the U.S. investment-grade bond market, including government, corporate, mortgage-backed, and asset-backed securities.
- 3-Month T-bill Yield (%): The yield on U.S. Treasury bills with a maturity of three months, reflecting short-term interest rates.
- 10-Year Treasury Yield (%): The yield on U.S. Treasury bonds with a maturity of ten years, reflecting long-term interest rates.
- 10Y-2Y Treasury Spread (%): The difference between the yields on 10-year and 2-year U.S. Treasury bonds, often used as an indicator of economic expectations.
- WTI Crude ($/bl): The price per barrel of West Texas Intermediate crude oil, a benchmark for U.S. oil prices.
- Gold ($/Troy Oz): The price per troy ounce of gold, a standard measure for gold prices.
- Bitcoin: A decentralized digital currency without a central bank or single administrator, which can be sent from user to user on the peer-to-peer bitcoin network.
This content was developed by Cambridge from sources believed to be reliable. This content is provided for informational purposes only and should not be construed or acted upon as individualized investment advice. It should not be considered a recommendation or solicitation. Information is subject to change. Any forward-looking statements are based on assumptions, may not materialize, and are subject to revision without notice. The information in this material is not intended as tax or legal advice.
Investing involves risk. Depending on the different types of investments there may be varying degrees of risk. Socially responsible investing does not guarantee any amount of success. Clients and prospective clients should be prepared to bear investment loss including loss of original principal. Indices mentioned are unmanaged and cannot be invested into directly. Past performance is not a guarantee of future results.
The Dow Jones Industrial Average (DJIA) is a price-weighted index composed of 30 widely traded blue-chip U.S. common stocks. The S&P 500 is a market-cap weighted index composed of the common stocks of 500 leading companies in leading industries of the U.S. economy. The NASDAQ Composite Index is a market-value weighted index of all common stocks listed on the NASDAQ stock exchange.
Securities offered through Cambridge Investment Research, Inc., a broker-dealer, member FINRA/SIPC, and investment advisory services offered through Cambridge Investment Research Advisors, Inc., a Registered Investment Adviser. Both are wholly-owned subsidiaries of Cambridge Investment Group, Inc. V.CIR.0426-1463