Weekly Market Commentary
December 15th, 2025
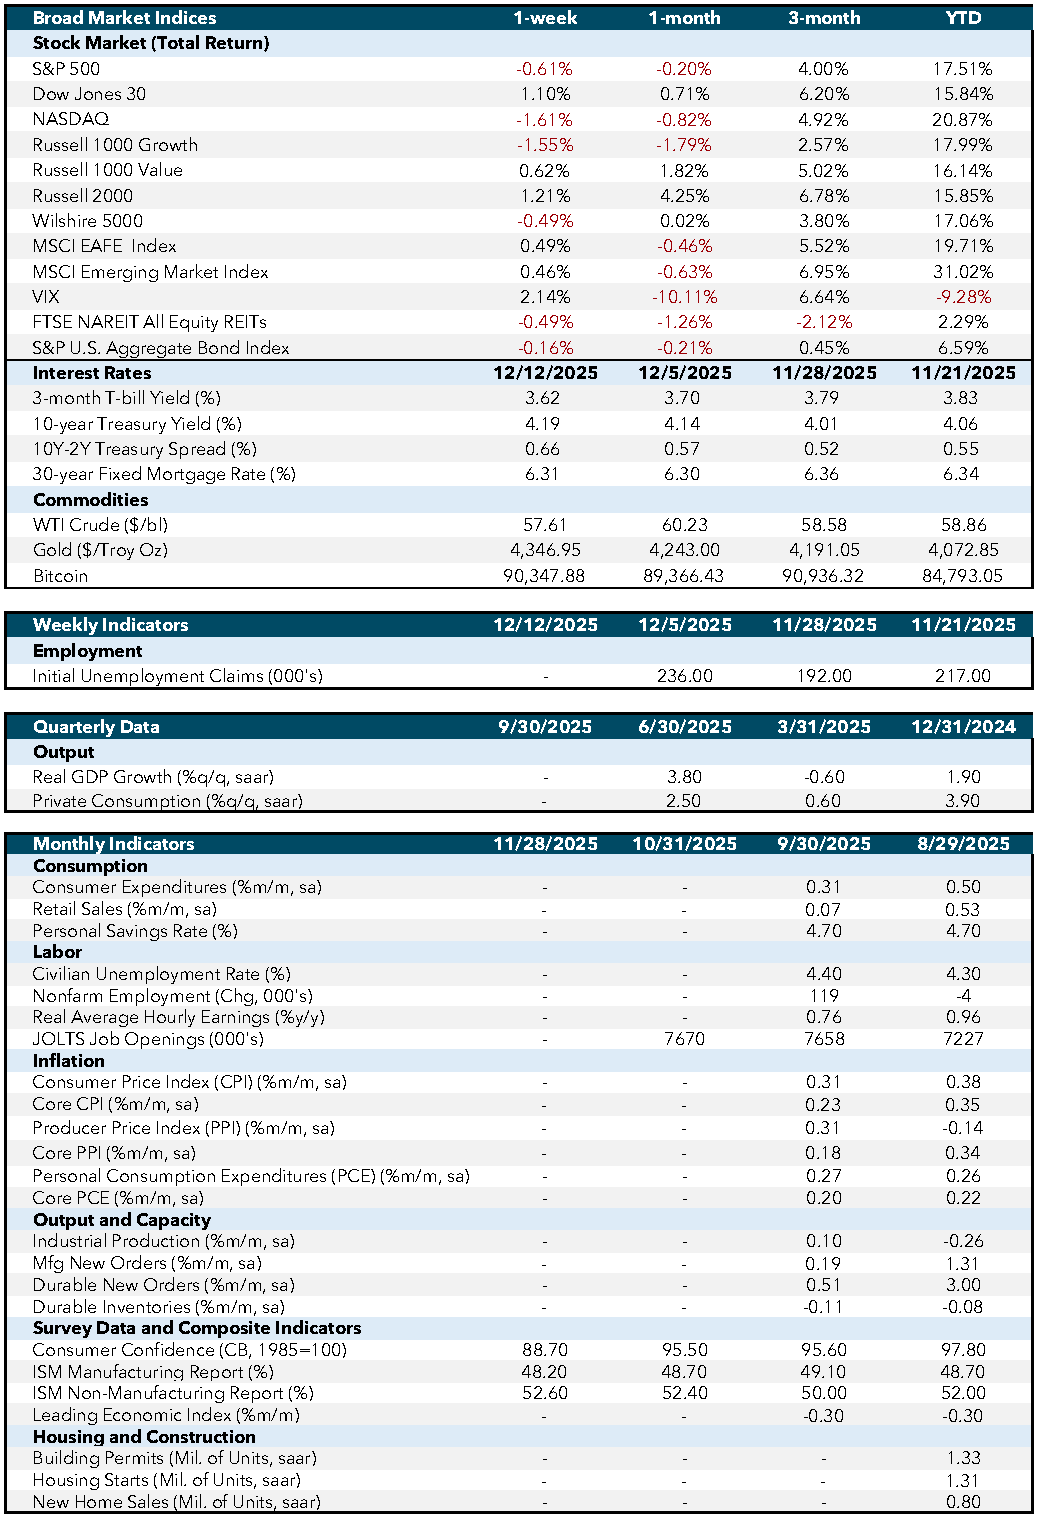
Week in Review…
Last week’s economic calendar painted a nuanced picture of the U.S. economy, reflecting a softening labor market, mixed consumer activity, and divergent signals from manufacturing and services sectors.
The Job Openings and Labor Turnover Survey (JOLTS) report, released Tuesday for October, showed job openings steady at 7.7 million, holding at a 4.6% rate. The Federal Reserve’s Wednesday decision saw the Federal Open Market Committee (FOMC) vote to cut the policy rate by 25 basis points, bringing the federal funds target range to 3.50-3.75%. The Fed acknowledged slowing job growth and persistent inflation, signaling vigilance ahead. Chair Powell emphasized data dependence, while the “dot plot” suggested only one more rate cut in 2026.
On Thursday, initial jobless claims surged by 44,000 to 236,000, marking the largest weekly increase since the pandemic’s onset. Despite seasonal volatility post-Thanksgiving—economists stressed the four-week average remained stable—this spike reinforced market concerns about labor market fragility.
Friday’s retail sales data for November revealed a broad slowdown. Headline sales were flat month-over-month, below expectations, while the “control group” (excluding auto, gas, and services) rebounded modestly at +0.7%. Electronics and furniture saw notable strength, but building materials lagged, hinting at softer consumer momentum.
In sum, the week’s releases underscore a labor market losing steam and a cautious consumer base. The Fed’s rate cut aligns with this evolving backdrop, but persistent inflation and mixed signals leave further easing uncertain.
Economic and Capital Markets Dashboard
Week Ahead…

The week ahead brings several critical data releases that could shape market sentiment and policy expectations. On Tuesday, attention turns to the labor market with nonfarm payrolls and the unemployment rate. These indicators will provide a clear snapshot of hiring momentum and overall economic resilience. A strong labor report would reinforce confidence in growth, while signs of weakness could amplify concerns about slowing demand. Also on Tuesday, manufacturing and services Purchasing Managers’ Index (PMI) readings will offer insight into business activity. Divergence between these sectors could highlight the economy’s uneven footing, with manufacturing often signaling global trade pressures and services reflecting domestic strength.
On Thursday, the Consumer Price Index (CPI) will take center stage as investors gauge inflation trends. This report is pivotal for assessing whether price pressures are easing enough to keep the Federal Reserve on its current path. A softer reading could bolster expectations for policy accommodation, while persistent inflation might temper hopes for further rate cuts.
Finally, Friday’s Personal Consumption Expenditures (PCE) price index, the Fed’s preferred inflation gauge, will round out the week. This measure not only tracks inflation but also reflects consumer spending behavior, making it a key determinant of monetary policy direction. Together, these releases will provide a comprehensive view of labor conditions, business activity, and inflation dynamics—critical inputs for markets navigating an uncertain economic landscape.
Economic Indicators:
- CPI: Consumer Price Index measures the average change in prices paid by consumers for goods and services over time. Source: Bureau of Labor Statistics.
- Core CPI: Core Consumer Price Index excludes food and energy prices to provide a clearer picture of long-term inflation trends. Source: Bureau of Labor Statistics.
- PPI: Producer Price Index measures the average change in selling prices received by domestic producers for their output. Source: Bureau of Labor Statistics.
- Core PPI: Core Producer Price Index excludes food and energy prices to provide a clearer picture of long-term inflation trends. Source: Bureau of Labor Statistics.
- PCE: Personal Consumption Expenditures measure the average change in prices paid by consumers for goods and services. Source: Bureau of Economic Analysis.
- Core PCE: Core Personal Consumption Expenditures exclude food and energy prices to provide a clearer picture of long-term inflation trends. Source: Bureau of Economic Analysis.
- Industrial Production: Measures the output of the industrial sector, including manufacturing, mining, and utilities. Source: Federal Reserve.
- Mfg New Orders: Measures the value of new orders placed with manufacturers for durable and non-durable goods. Source: Census Bureau.
- Durable New Orders: Measures the value of new orders placed with manufacturers of durable goods. Source: Census Bureau.
- Durable Inventories: Measures the value of inventories held by manufacturers for durable goods. Source: Census Bureau.
- Consumer Confidence (CB, 1985=100): Measures the degree of optimism that consumers feel about the overall state of the economy and their personal financial situation. Source: Conference Board.
- ISM Manufacturing Report: Measures the economic health of the manufacturing sector based on surveys of purchasing managers. Source: Institute for Supply Management.
- ISM Non-Manufacturing Report: Measures the economic health of the non-manufacturing sector based on surveys of purchasing managers. Source: Institute for Supply Management.
- Leading Economic Index: Measures overall economic activity and predicts future economic trends. Source: Conference Board.
- Building Permits (Mil. of Units, saar): Measures the number of new residential building permits issued. Source: Census Bureau.
- Housing Starts (Mil. of Units, saar): Measures the number of new residential construction projects that have begun. Source: Census Bureau.
- New Home Sales (Mil. of Units, saar): Measures the number of newly constructed homes sold. Source: Census Bureau.
- SA: Seasonally adjusted.
- SAAR: Seasonally adjusted annual rate.
Market Indices & Indicators:
- S&P 500: A market-capitalization-weighted index of 500 leading publicly traded companies in the U.S., widely regarded as one of the best gauges of large U.S. stocks and the stock market overall.
- Dow Jones 30: Also known as the Dow Jones Industrial Average, it tracks the share price performance of 30 large, publicly traded U.S. companies, serving as a barometer of the stock market and economy.
- NASDAQ: The world’s first electronic stock exchange, primarily listing technology giants and operating 29 markets globally.
- Russell 1000 Growth: Measures the performance of large-cap growth segment of the U.S. equity universe, including companies with higher price-to-book ratios and growth metrics.
- Russell 1000 Value: Measures the performance of large-cap value segment of the U.S. equity universe, including companies with lower price-to-book ratios and growth metrics.
- Russell 2000: A market index composed of 2,000 small-cap companies, widely used as a benchmark for small-cap mutual funds.
- Wilshire 5000: A market-capitalization-weighted index capturing the performance of all American stocks actively traded in the U.S., representing the broadest measure of the U.S. stock market.
- MSCI EAFE Index: An equity index capturing large and mid-cap representation across developed markets countries around the world, excluding the U.S. and Canada.
- MSCI Emerging Market Index: Captures large and mid-cap representation across emerging markets countries, covering approximately 85% of the free float-adjusted market capitalization in each country.
- VIX: The CBOE Volatility Index measures the market’s expectations for volatility over the coming 30 days, often referred to as the “fear gauge.”
- FTSE NAREIT All Equity REITs: Measures the performance of all publicly traded equity real estate investment trusts (REITs) listed in the U.S., excluding mortgage REITs.
- S&P U.S. Aggregate Bond Index: Represents the performance of the U.S. investment-grade bond market, including government, corporate, mortgage-backed, and asset-backed securities.
- 3-Month T-bill Yield (%): The yield on U.S. Treasury bills with a maturity of three months, reflecting short-term interest rates.
- 10-Year Treasury Yield (%): The yield on U.S. Treasury bonds with a maturity of ten years, reflecting long-term interest rates.
- 10Y-2Y Treasury Spread (%): The difference between the yields on 10-year and 2-year U.S. Treasury bonds, often used as an indicator of economic expectations.
- WTI Crude ($/bl): The price per barrel of West Texas Intermediate crude oil, a benchmark for U.S. oil prices.
- Gold ($/Troy Oz): The price per troy ounce of gold, a standard measure for gold prices.
- Bitcoin: A decentralized digital currency without a central bank or single administrator, which can be sent from user to user on the peer-to-peer bitcoin network.
This content was developed by Cambridge from sources believed to be reliable. This content is provided for informational purposes only and should not be construed or acted upon as individualized investment advice. It should not be considered a recommendation or solicitation. Information is subject to change. Any forward-looking statements are based on assumptions, may not materialize, and are subject to revision without notice. The information in this material is not intended as tax or legal advice.
Investing involves risk. Depending on the different types of investments there may be varying degrees of risk. Socially responsible investing does not guarantee any amount of success. Clients and prospective clients should be prepared to bear investment loss including loss of original principal. Indices mentioned are unmanaged and cannot be invested into directly. Past performance is not a guarantee of future results.
The Dow Jones Industrial Average (DJIA) is a price-weighted index composed of 30 widely traded blue-chip U.S. common stocks. The S&P 500 is a market-cap weighted index composed of the common stocks of 500 leading companies in leading industries of the U.S. economy. The NASDAQ Composite Index is a market-value weighted index of all common stocks listed on the NASDAQ stock exchange.
Securities offered through Cambridge Investment Research, Inc., a broker-dealer, member FINRA/SIPC, and investment advisory services offered through Cambridge Investment Research Advisors, Inc., a Registered Investment Adviser. Both are wholly-owned subsidiaries of Cambridge Investment Group, Inc. V.CIR.1225-4554