Weekly Market Commentary
November 24th, 2025
Week in Review…
This week’s economic data releases offered a broad update on labor-market momentum, inflation pressures, and business-sector activity, particularly important because several reports were delayed during the recent government shutdown. The Federal Open Market Committee (FOMC) Meeting Minutes signaled a committee still committed to a data-dependent stance. Officials noted cooling in some inflation components but emphasized uneven progress, and several expressed concern inflation could stall above the 2% target. While members acknowledged loosening labor conditions, there was no urgency to cut rates; the tone suggested the Fed is comfortable staying restrictive until inflation improves more consistently.
Labor-market data showed gradual cooling. Initial jobless claims remained low, underscoring resilience in labor demand, but continuing claims drifted higher, suggesting it is taking longer for unemployed workers to find jobs. The nonfarm payrolls report, delayed earlier by the shutdown, showed moderating job growth concentrated in healthcare and government, while cyclical sectors like manufacturing and transportation softened. The unemployment rate ticked higher, partly due to rising labor-force participation. This mix – steady hiring, slightly higher unemployment, and broader labor supply – supports a narrative of normalization rather than recessionary stress.
Manufacturing Purchasing Managers’ Index (PMI) stayed in contraction, pointing to muted orders and cautious inventory management, though input costs eased and delivery times improved, signaling supply-chain inflation continues to unwind. Services PMI remained modestly expansionary, with stable demand in consumer-facing categories despite elevated wage and rent costs. Together, PMI data reflect an economy still growing but at a slower, uneven pace as rate sensitivity spreads from goods to services.
Overall, these releases confirm slower but steady job creation and gradual cooling in economic momentum. Fed minutes show policymakers remain cautious, balancing inflation progress with the risk of easing too soon.
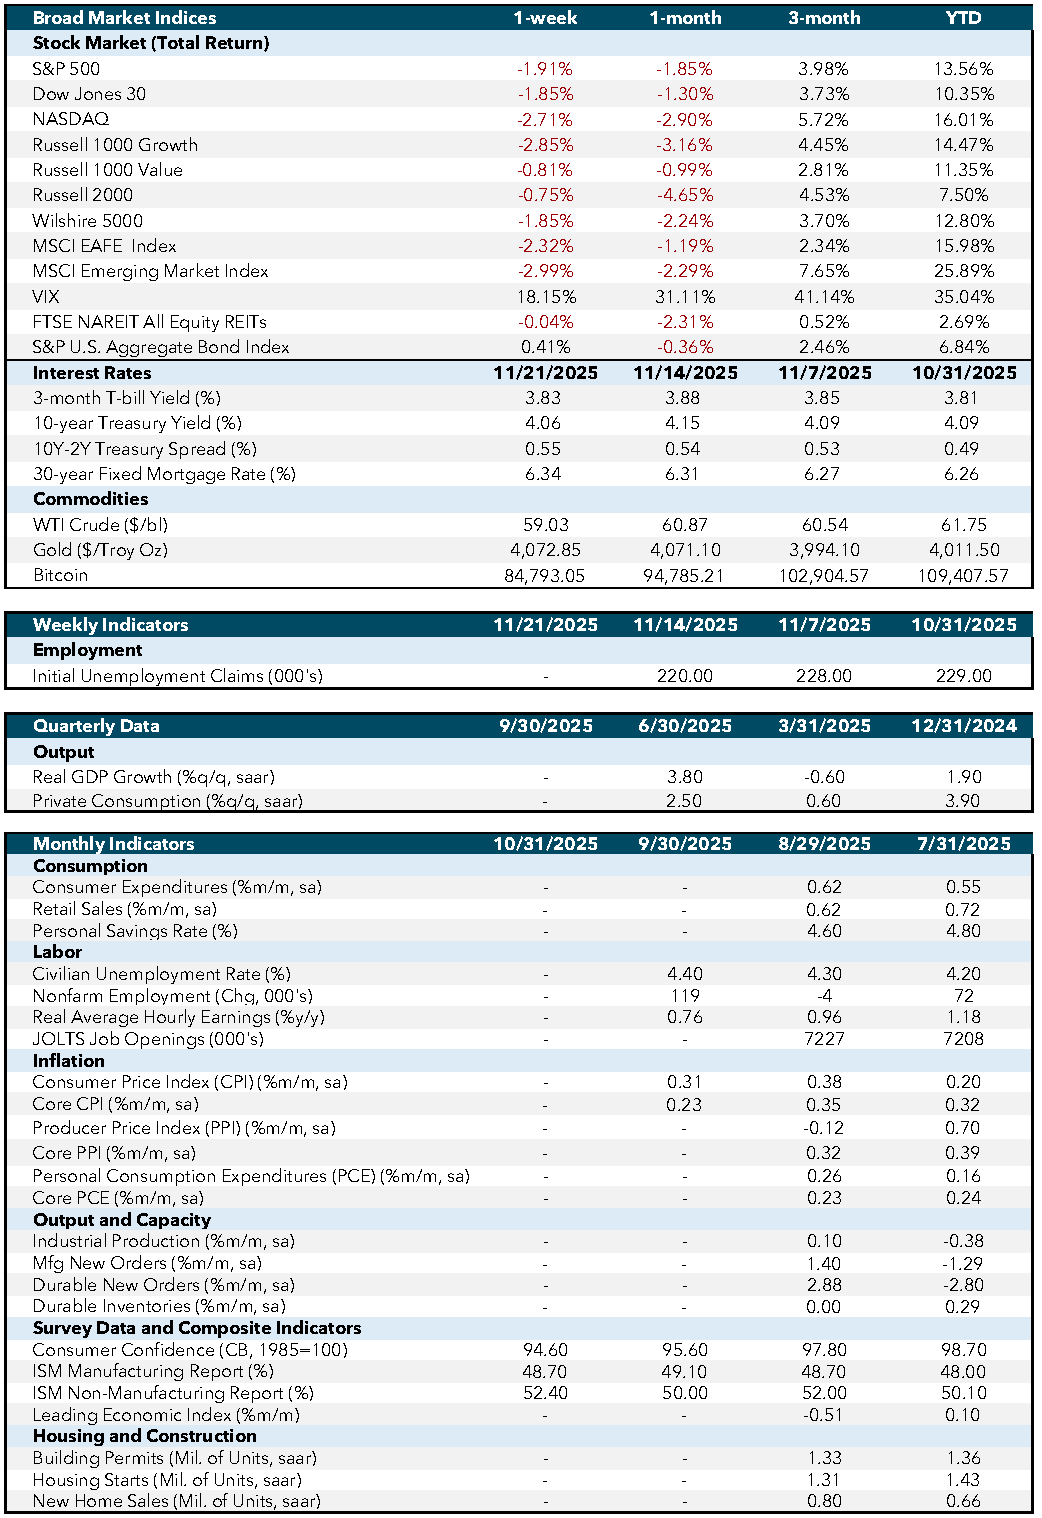
Economic and Capital Markets Dashboard
Week Ahead…

The coming week brings several high-impact releases that will sharpen the outlook for consumer spending, inflation, and growth. Retail sales (Tuesday) will offer an early read on holiday season momentum, with discretionary categories watched closely as households face higher prices and tighter credit. Consumer Confidence (Tuesday) will provide another gauge of sentiment, which has been drifting lower amid rising borrowing costs and economic uncertainty.
Later in the week, the gross domestic product (GDP) update (Thursday) will clarify whether earlier strength in consumption and inventories persisted or began to fade. The most consequential release comes Friday with the Personal Consumption Expenditures (PCE) price index, the Fed’s preferred inflation gauge. Markets will focus on whether core PCE continues easing toward the 2% target, reinforcing the disinflation trend seen in recent Consumer Price Index (CPI) and Producer Price Index (PPI) reports. Initial jobless claims (Thursday) will also be monitored for signs of labor-market shifts.
Together, these reports will shape expectations for the Fed’s policy path into year-end, with PCE and retail sales carrying the greatest weight for near-term rate-cut discussions.
Economic Indicators:
- CPI: Consumer Price Index measures the average change in prices paid by consumers for goods and services over time. Source: Bureau of Labor Statistics.
- Core CPI: Core Consumer Price Index excludes food and energy prices to provide a clearer picture of long-term inflation trends. Source: Bureau of Labor Statistics.
- PPI: Producer Price Index measures the average change in selling prices received by domestic producers for their output. Source: Bureau of Labor Statistics.
- Core PPI: Core Producer Price Index excludes food and energy prices to provide a clearer picture of long-term inflation trends. Source: Bureau of Labor Statistics.
- PCE: Personal Consumption Expenditures measure the average change in prices paid by consumers for goods and services. Source: Bureau of Economic Analysis.
- Core PCE: Core Personal Consumption Expenditures exclude food and energy prices to provide a clearer picture of long-term inflation trends. Source: Bureau of Economic Analysis.
- Industrial Production: Measures the output of the industrial sector, including manufacturing, mining, and utilities. Source: Federal Reserve.
- Mfg New Orders: Measures the value of new orders placed with manufacturers for durable and non-durable goods. Source: Census Bureau.
- Durable New Orders: Measures the value of new orders placed with manufacturers of durable goods. Source: Census Bureau.
- Durable Inventories: Measures the value of inventories held by manufacturers for durable goods. Source: Census Bureau.
- Consumer Confidence (CB, 1985=100): Measures the degree of optimism that consumers feel about the overall state of the economy and their personal financial situation. Source: Conference Board.
- ISM Manufacturing Report: Measures the economic health of the manufacturing sector based on surveys of purchasing managers. Source: Institute for Supply Management.
- ISM Non-Manufacturing Report: Measures the economic health of the non-manufacturing sector based on surveys of purchasing managers. Source: Institute for Supply Management.
- Leading Economic Index: Measures overall economic activity and predicts future economic trends. Source: Conference Board.
- Building Permits (Mil. of Units, saar): Measures the number of new residential building permits issued. Source: Census Bureau.
- Housing Starts (Mil. of Units, saar): Measures the number of new residential construction projects that have begun. Source: Census Bureau.
- New Home Sales (Mil. of Units, saar): Measures the number of newly constructed homes sold. Source: Census Bureau.
- SA: Seasonally adjusted.
- SAAR: Seasonally adjusted annual rate.
Market Indices & Indicators:
- S&P 500: A market-capitalization-weighted index of 500 leading publicly traded companies in the U.S., widely regarded as one of the best gauges of large U.S. stocks and the stock market overall.
- Dow Jones 30: Also known as the Dow Jones Industrial Average, it tracks the share price performance of 30 large, publicly traded U.S. companies, serving as a barometer of the stock market and economy.
- NASDAQ: The world’s first electronic stock exchange, primarily listing technology giants and operating 29 markets globally.
- Russell 1000 Growth: Measures the performance of large-cap growth segment of the U.S. equity universe, including companies with higher price-to-book ratios and growth metrics.
- Russell 1000 Value: Measures the performance of large-cap value segment of the U.S. equity universe, including companies with lower price-to-book ratios and growth metrics.
- Russell 2000: A market index composed of 2,000 small-cap companies, widely used as a benchmark for small-cap mutual funds.
- Wilshire 5000: A market-capitalization-weighted index capturing the performance of all American stocks actively traded in the U.S., representing the broadest measure of the U.S. stock market.
- MSCI EAFE Index: An equity index capturing large and mid-cap representation across developed markets countries around the world, excluding the U.S. and Canada.
- MSCI Emerging Market Index: Captures large and mid-cap representation across emerging markets countries, covering approximately 85% of the free float-adjusted market capitalization in each country.
- VIX: The CBOE Volatility Index measures the market’s expectations for volatility over the coming 30 days, often referred to as the “fear gauge.”
- FTSE NAREIT All Equity REITs: Measures the performance of all publicly traded equity real estate investment trusts (REITs) listed in the U.S., excluding mortgage REITs.
- S&P U.S. Aggregate Bond Index: Represents the performance of the U.S. investment-grade bond market, including government, corporate, mortgage-backed, and asset-backed securities.
- 3-Month T-bill Yield (%): The yield on U.S. Treasury bills with a maturity of three months, reflecting short-term interest rates.
- 10-Year Treasury Yield (%): The yield on U.S. Treasury bonds with a maturity of ten years, reflecting long-term interest rates.
- 10Y-2Y Treasury Spread (%): The difference between the yields on 10-year and 2-year U.S. Treasury bonds, often used as an indicator of economic expectations.
- WTI Crude ($/bl): The price per barrel of West Texas Intermediate crude oil, a benchmark for U.S. oil prices.
- Gold ($/Troy Oz): The price per troy ounce of gold, a standard measure for gold prices.
- Bitcoin: A decentralized digital currency without a central bank or single administrator, which can be sent from user to user on the peer-to-peer bitcoin network.
This content was developed by Cambridge from sources believed to be reliable. This content is provided for informational purposes only and should not be construed or acted upon as individualized investment advice. It should not be considered a recommendation or solicitation. Information is subject to change. Any forward-looking statements are based on assumptions, may not materialize, and are subject to revision without notice. The information in this material is not intended as tax or legal advice.
Investing involves risk. Depending on the different types of investments there may be varying degrees of risk. Socially responsible investing does not guarantee any amount of success. Clients and prospective clients should be prepared to bear investment loss including loss of original principal. Indices mentioned are unmanaged and cannot be invested into directly. Past performance is not a guarantee of future results.
The Dow Jones Industrial Average (DJIA) is a price-weighted index composed of 30 widely traded blue-chip U.S. common stocks. The S&P 500 is a market-cap weighted index composed of the common stocks of 500 leading companies in leading industries of the U.S. economy. The NASDAQ Composite Index is a market-value weighted index of all common stocks listed on the NASDAQ stock exchange.
Securities offered through Cambridge Investment Research, Inc., a broker-dealer, member FINRA/SIPC, and investment advisory services offered through Cambridge Investment Research Advisors, Inc., a Registered Investment Adviser. Both are wholly-owned subsidiaries of Cambridge Investment Group, Inc. V.CIR.1125-4307