Weekly Market Commentary
December 1st, 2025
Week in Review…
Markets had a shortened trading week due to the Thanksgiving holiday, but several key economic reports provided insight into inflation trends, consumer behavior, and business activity.
Inflation Signals Remain Mixed
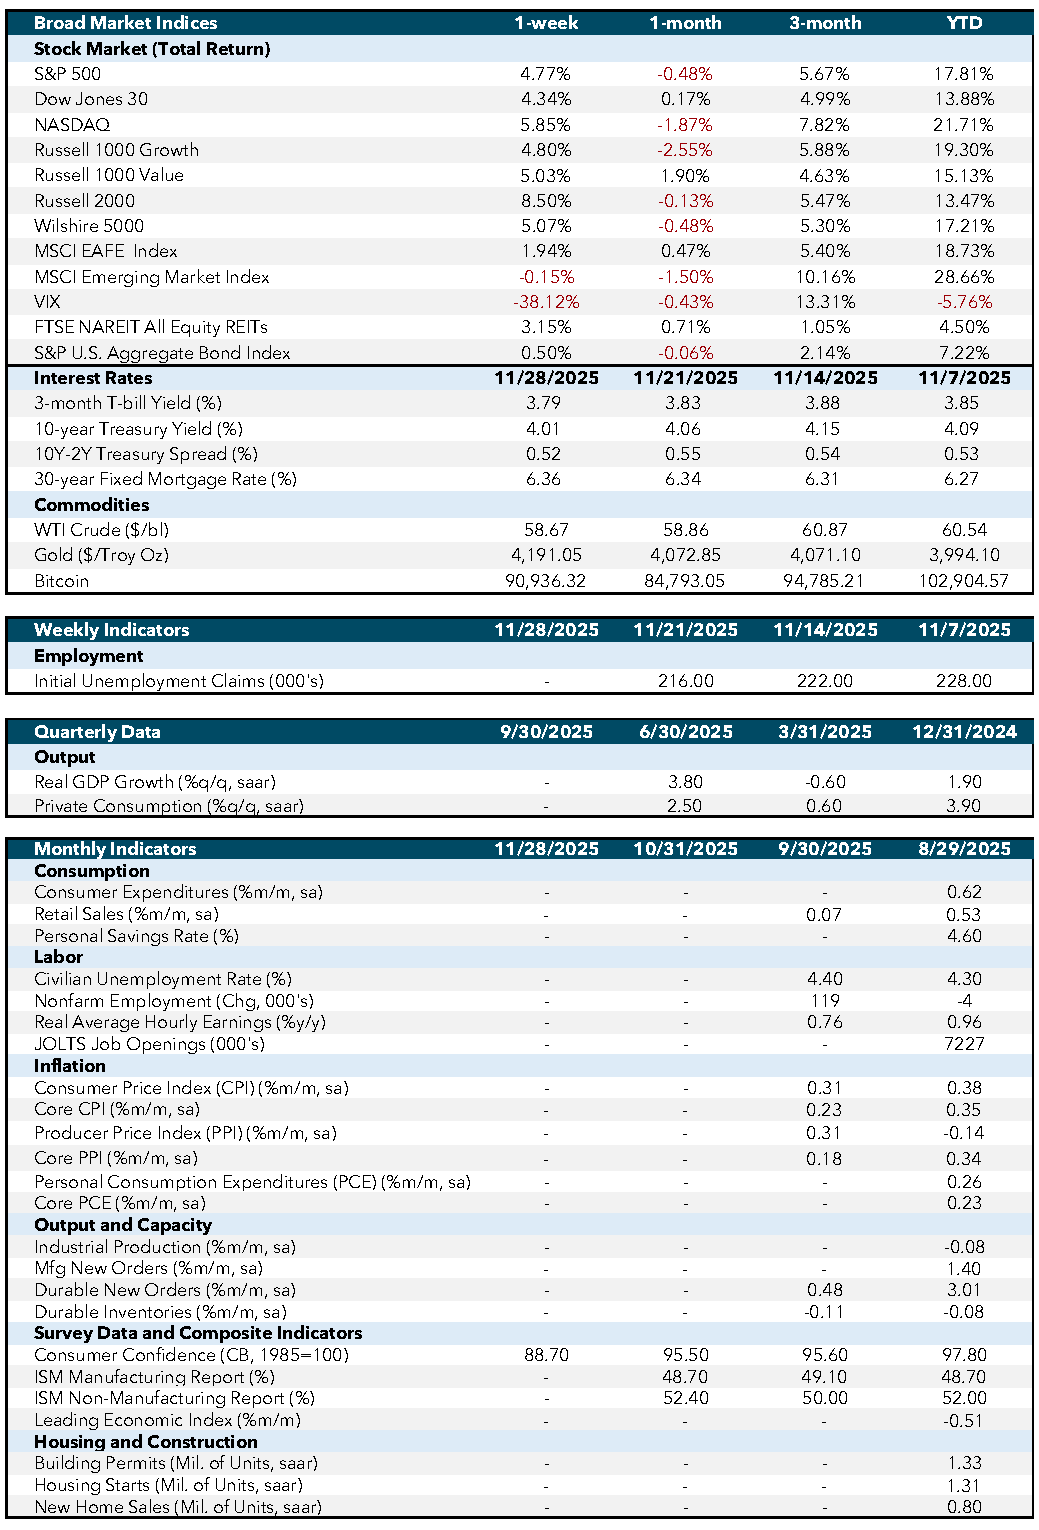
September’s Producer Price Index (PPI) rose 0.3% month-over-month, in line with expectations but higher than August’s -0.1% decline. The increase was largely driven by gasoline prices, which surged 11.8% and accounted for roughly 60% of the rise in final-demand goods. While higher energy costs can pressure corporate margins, the report suggests that structural inflationary pressures remain limited. The Beige Book echoed this view, noting moderate price increases and tariff-related cost pressures, but with mixed ability for firms to pass costs to consumers. Businesses expect cost pressures to persist, though near-term pricing plans remain uncertain.
Consumer Spending and Confidence Show Signs of Strain
Retail sales for September disappointed, with headline growth at 0.2% versus expectations of 0.4%, and well below August’s 0.6%. Core retail sales met forecasts at 0.3% but also softened from prior levels. Adding to the cautious tone, the Conference Board’s Consumer Confidence Index saw a significant decline in November, dropping from 95.5 to 88.7. Additionally, the Expectations Index fell to 63.2, marking the tenth straight month below the recession warning level of 80. All components of the index deteriorated, signaling heightened concerns about income, business conditions, and the labor market.
Housing and Business Investment Offer Bright Spots
Despite weaker sentiment, housing activity surprised to the upside. Pending home sales rose 1.9%, well above the 0.5% forecast, as buyers appear to be taking advantage of lower mortgage rates and stable home prices. The House Price Index confirmed that prices were flat in September. Meanwhile, durable goods orders provided a positive signal for manufacturing, with core orders rising 0.6%, slightly above August’s 0.5%, suggesting continued investment in long-lasting goods.
Economic and Capital Markets Dashboard
Week Ahead…

Markets enter the week focused on three key themes: sentiment, inflation, and labor, as investors look for clues on the Fed’s next move.
Sentiment Indicators Take Center Stage
The week begins with manufacturing Purchasing Managers’ Index (PMI) readings from ISM and S&P Global on Monday, followed by services PMIs on Wednesday. These surveys are closely watched because purchasing managers often have early insight into business conditions, making PMIs leading indicators of economic activity. While services carry more weight in gross domestic product (GDP), manufacturing remains highly cyclical and can signal turning points in the economic cycle. ISM delivers insights focused on the United States, whereas S&P Global presents a broader picture of global supply chains and demand trends. Consequently, analysts will closely monitor any differences that may emerge between domestic and international trends. Sub-indexes, particularly ISM’s Prices Paid, will be scrutinized for signs of inflationary pressure.
Inflation Data Could Shape Fed Expectations
Beyond sentiment, inflation reports will dominate midweek headlines. The University of Michigan will release its 1- and 5-year inflation expectations, offering insight into consumer and business outlooks. More importantly, the Core Personal Consumption Expenditures (PCE) Price Index, the Federal Reserve’s preferred gauge of inflation, will be released on Friday. Despite its lag, this measure is chain-weighted to reflect changing consumer behavior and will provide critical clarity for a data-dependent Fed. Markets currently price in an 86% chance of a 25 bps rate cut, but an upside surprise in core PCE could challenge that view.
Labor Market in Focus
The Fed’s dual mandate means employment data will also be pivotal. Tuesday’s Job Openings and Labor Turnover Survey (JOLTS) report, though somewhat dated, will offer valuable insights into job openings, voluntary separations, and overall labor market tightness, serving as important indicators of potential wage pressures. Wednesday’s ADP employment report will offer a more current snapshot of hiring trends ahead of Friday’s official payrolls report. After October’s upside surprise, investors will watch closely to see if the labor market is stabilizing or softening further.
Taken together, these reports underscore an economy facing crosscurrents – softening consumer demand, resilient housing, and inflation signals that keep the Fed in focus.
Economic Indicators:
- CPI: Consumer Price Index measures the average change in prices paid by consumers for goods and services over time. Source: Bureau of Labor Statistics.
- Core CPI: Core Consumer Price Index excludes food and energy prices to provide a clearer picture of long-term inflation trends. Source: Bureau of Labor Statistics.
- PPI: Producer Price Index measures the average change in selling prices received by domestic producers for their output. Source: Bureau of Labor Statistics.
- Core PPI: Core Producer Price Index excludes food and energy prices to provide a clearer picture of long-term inflation trends. Source: Bureau of Labor Statistics.
- PCE: Personal Consumption Expenditures measure the average change in prices paid by consumers for goods and services. Source: Bureau of Economic Analysis.
- Core PCE: Core Personal Consumption Expenditures exclude food and energy prices to provide a clearer picture of long-term inflation trends. Source: Bureau of Economic Analysis.
- Industrial Production: Measures the output of the industrial sector, including manufacturing, mining, and utilities. Source: Federal Reserve.
- Mfg New Orders: Measures the value of new orders placed with manufacturers for durable and non-durable goods. Source: Census Bureau.
- Durable New Orders: Measures the value of new orders placed with manufacturers of durable goods. Source: Census Bureau.
- Durable Inventories: Measures the value of inventories held by manufacturers for durable goods. Source: Census Bureau.
- Consumer Confidence (CB, 1985=100): Measures the degree of optimism that consumers feel about the overall state of the economy and their personal financial situation. Source: Conference Board.
- ISM Manufacturing Report: Measures the economic health of the manufacturing sector based on surveys of purchasing managers. Source: Institute for Supply Management.
- ISM Non-Manufacturing Report: Measures the economic health of the non-manufacturing sector based on surveys of purchasing managers. Source: Institute for Supply Management.
- Leading Economic Index: Measures overall economic activity and predicts future economic trends. Source: Conference Board.
- Building Permits (Mil. of Units, saar): Measures the number of new residential building permits issued. Source: Census Bureau.
- Housing Starts (Mil. of Units, saar): Measures the number of new residential construction projects that have begun. Source: Census Bureau.
- New Home Sales (Mil. of Units, saar): Measures the number of newly constructed homes sold. Source: Census Bureau.
- SA: Seasonally adjusted.
- SAAR: Seasonally adjusted annual rate.
Market Indices & Indicators:
- S&P 500: A market-capitalization-weighted index of 500 leading publicly traded companies in the U.S., widely regarded as one of the best gauges of large U.S. stocks and the stock market overall.
- Dow Jones 30: Also known as the Dow Jones Industrial Average, it tracks the share price performance of 30 large, publicly traded U.S. companies, serving as a barometer of the stock market and economy.
- NASDAQ: The world’s first electronic stock exchange, primarily listing technology giants and operating 29 markets globally.
- Russell 1000 Growth: Measures the performance of large-cap growth segment of the U.S. equity universe, including companies with higher price-to-book ratios and growth metrics.
- Russell 1000 Value: Measures the performance of large-cap value segment of the U.S. equity universe, including companies with lower price-to-book ratios and growth metrics.
- Russell 2000: A market index composed of 2,000 small-cap companies, widely used as a benchmark for small-cap mutual funds.
- Wilshire 5000: A market-capitalization-weighted index capturing the performance of all American stocks actively traded in the U.S., representing the broadest measure of the U.S. stock market.
- MSCI EAFE Index: An equity index capturing large and mid-cap representation across developed markets countries around the world, excluding the U.S. and Canada.
- MSCI Emerging Market Index: Captures large and mid-cap representation across emerging markets countries, covering approximately 85% of the free float-adjusted market capitalization in each country.
- VIX: The CBOE Volatility Index measures the market’s expectations for volatility over the coming 30 days, often referred to as the “fear gauge.”
- FTSE NAREIT All Equity REITs: Measures the performance of all publicly traded equity real estate investment trusts (REITs) listed in the U.S., excluding mortgage REITs.
- S&P U.S. Aggregate Bond Index: Represents the performance of the U.S. investment-grade bond market, including government, corporate, mortgage-backed, and asset-backed securities.
- 3-Month T-bill Yield (%): The yield on U.S. Treasury bills with a maturity of three months, reflecting short-term interest rates.
- 10-Year Treasury Yield (%): The yield on U.S. Treasury bonds with a maturity of ten years, reflecting long-term interest rates.
- 10Y-2Y Treasury Spread (%): The difference between the yields on 10-year and 2-year U.S. Treasury bonds, often used as an indicator of economic expectations.
- WTI Crude ($/bl): The price per barrel of West Texas Intermediate crude oil, a benchmark for U.S. oil prices.
- Gold ($/Troy Oz): The price per troy ounce of gold, a standard measure for gold prices.
- Bitcoin: A decentralized digital currency without a central bank or single administrator, which can be sent from user to user on the peer-to-peer bitcoin network.
This content was developed by Cambridge from sources believed to be reliable. This content is provided for informational purposes only and should not be construed or acted upon as individualized investment advice. It should not be considered a recommendation or solicitation. Information is subject to change. Any forward-looking statements are based on assumptions, may not materialize, and are subject to revision without notice. The information in this material is not intended as tax or legal advice.
Investing involves risk. Depending on the different types of investments there may be varying degrees of risk. Socially responsible investing does not guarantee any amount of success. Clients and prospective clients should be prepared to bear investment loss including loss of original principal. Indices mentioned are unmanaged and cannot be invested into directly. Past performance is not a guarantee of future results.
The Dow Jones Industrial Average (DJIA) is a price-weighted index composed of 30 widely traded blue-chip U.S. common stocks. The S&P 500 is a market-cap weighted index composed of the common stocks of 500 leading companies in leading industries of the U.S. economy. The NASDAQ Composite Index is a market-value weighted index of all common stocks listed on the NASDAQ stock exchange.
Securities offered through Cambridge Investment Research, Inc., a broker-dealer, member FINRA/SIPC, and investment advisory services offered through Cambridge Investment Research Advisors, Inc., a Registered Investment Adviser. Both are wholly-owned subsidiaries of Cambridge Investment Group, Inc. V.CIR.